|
The Databases - SOLAR DATABASE
Solar indices can be collected from the DXCluster and stored in the Solar database,
various interesting and useful graphs can be generated from this data.
Use of this feature requires data to be collected from the DXCluster, preferably on a daily basis,
as the Solar database is supplied empty.
menu/Database/Solar
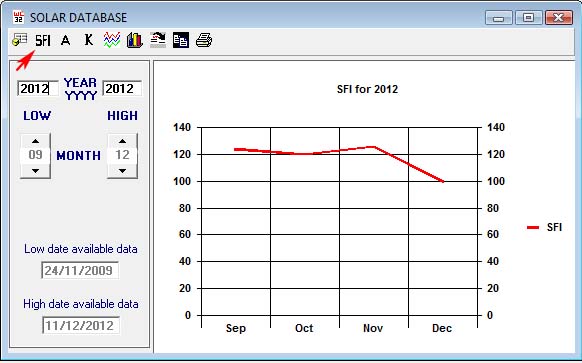
This example shows graphically the Solar Flux Index (SFI) for September to December 2012 from data already collected.
The solar database can be updated direct from the DXCluster link when a WWV or WCY spot
is received from the cluster - it is possible to enter data manually.
There is a provision for recording SFI (Solar Flux Index), A-Index and K-Index and limited ‘remarks’.
The solar indices can be viewed in table form or viewed in charts, if you don't
know what these values represent then it is likely that you do not need to concern
yourself with this feature.
The charts displayed are dependent on the completeness of data in the database,
data is analysed and averaged for the selected period, any zero data entries are ignored.
The Solar database data is stored in the DXCluster database.
When data has been added to the Solar database, the following features are available from the toolbar.
Toolbar button #1: Displays raw data or the Chart display.
Toolbar button #2: Calculate and display SFI charts for the selected period.
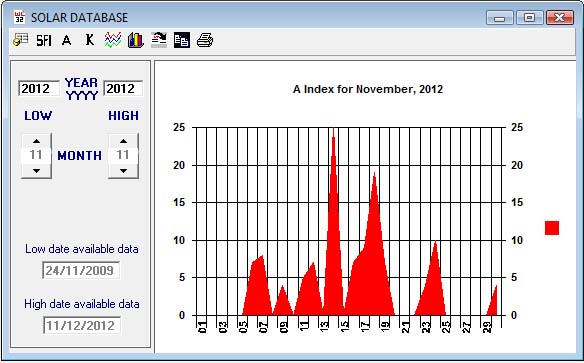
Toolbar button #3: Calculate and display A index charts for the selected period.
Toolbar button #4: Calculate and display K index charts for the selected period.
Toolbar button #5: Combines display of SFI/A/K in one chart for the selected period.
Toolbar button #6: Change Chart display type.
Toolbar button #7: Export solar data in delimited ASCII text format.
Toolbar button #8: Copy the chart to the clipboard for use in image editing software.
Toolbar button #9: Print data from the Solar database.
Adding data to the database automatically requires the DXCluster running,
When WWV ‘spots’ are received, they are added to the Solar database providing they are presented
in expected format and that the option DXCluster/OPTION/Add to Solar Database’ is enabled.
How to set this option in the DXCluster window here.
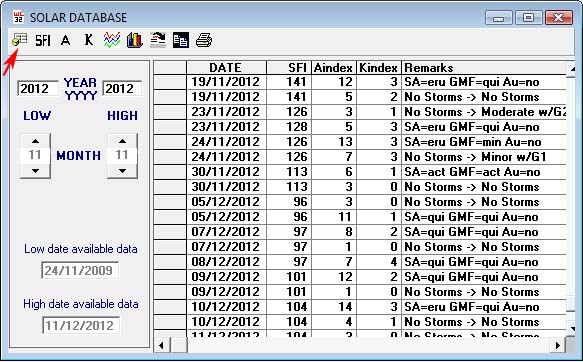
Adding data manually:
Switch to the raw data display with toolbar button #1.
Add appropriate data to the fields, care should be taken to observe the correct data types.
Displaying chart data for one Month:
Set the 'Low' and 'High' month to the same month value e.g. for June
set both 'High' and 'Low' month to "6" and 'High' and 'Low' year should be set to the same value and
the year of interest.
Click the appropriate toolbar button to display.
Displaying chart data for more than one month:
Set the 'Low' and 'High' month to period required, e.g.
"6" and "12" for second half of year, set both 'High' and 'Low' year to the year
of interest.
Click the toolbar button for the required display.
Displaying chart data for more than one year:
Set the 'Low' and 'High' year to the period required, e.g. "2010" and "2012".
Click the toolbar button for the required display.
Set the 'Months' using the up/down arrows.
Set 'Years' by direct entry. N.B. The complete year should be entered as YYYY, e.g. '2012'.
Periods can NOT be overlapped, e.g. a month display spanning 2011 to 2012.
"Low date available data" indicates the earliest data available in the database.
"High date available data" indicates the latest data available in the database.
Charts can not be generated beyond these date limits as no data exists.
|