|
CHARTS
Menu/Reports/Charts
Overview
Winlog32 generates and displays charts from QSO data entered into your current loaded Log.
The chart window must be closed and re-opened if a different Log is loaded or if the current Log has been edited.
The chart display can be resized when the Chart window is normalised.
Different charts are selected from the toolbar buttons, only one chart is displayed.
Copy (to clipboard) option enables pasting the current chart into image software.
The chart image can be printed.
Toolbar Option #1: 'QSO's Per MONTH'.
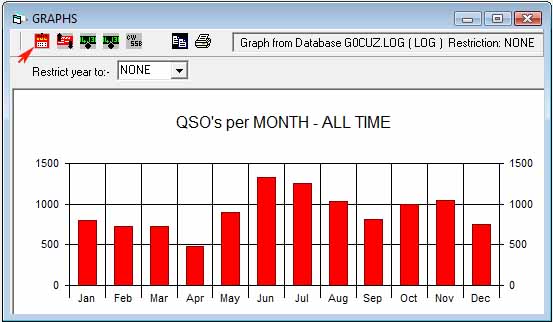
The chart displays total QSOs made for each month, the twelve month period is fixed.
The complete Log period is presented as a single year term but can be further restricted to any single year period.
In the above example, 'NONE' has been selected (default) and the complete Log period is displayed.
Toolbar Option #2: 'QSL OUT / QSL IN CHART'.
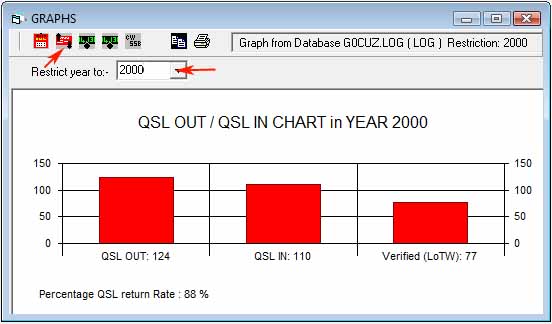
Bureau and direct cards and LoTW (verified)
Displays the entire Log or restrict to a single year.
The chart is generated from the Logs QSLIN/OUT "B", "D" and "V" data.
The above example displays QSLing in 2000.
N.B. 'Verified' only shows incoming LoTW verifications, it is assumed that all QSOs would have been uploaded to LoTW.
Toolbar Option #3: 'BAND USE'.
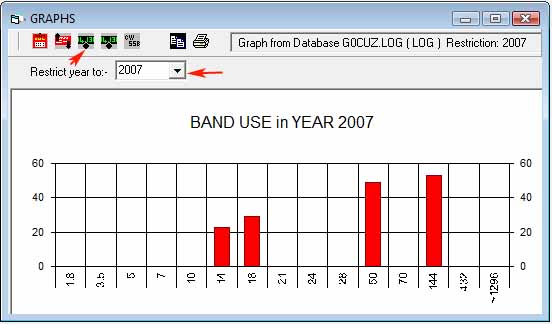
This charts band usage for all QSOs, this can be restricted to any single year.
The above example displays band usage in '2007'
Toolbar Option #4: 'MY BAND USE'.
This is similar to Option #3. but displays only previously defined bands as displayed in the logs band selector.
The bands are defined in menu/options/settings TAB Custom Lists.
Toolbar Option #5: MODE USE
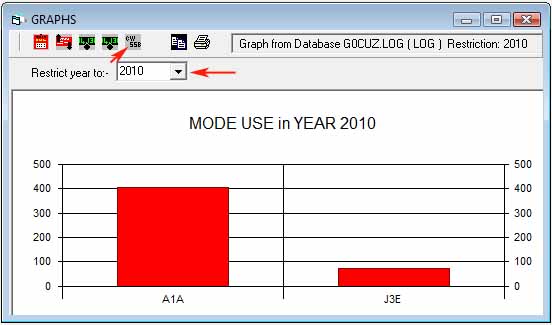
Charts Mode usage for all Log QSOs, this can be restricted to a single year.
Displays the Modes in the Log mode selector which are defined in menu/options/settings TAB Custom Lists.
The above example displays mode usage in 2010.
Toolbar Option #6: 'Copy to Clipboard'.
The current chart image is copied to Windows clipboard and can be pasted (ctrl+V) into suitable image editing software.
Toolbar Option #7: Print.
The current chart image is sent to the printer.
|